-
- Global
- Algeria, Djazair
- Angola
- Argentina
- Australia
- Belgium
- Brazil
- Chile
- China
- Cyprus
- Dominicana
- Ecuador
- Egypt
- EU Intermodal
- Hong Kong
- India
- Indonesia
- Malaysia
- Mozambique
- New Zealand
- Pakistan
- Peru
- Philippines
- Romania
- Rwanda
- Saudi Arabia
- Senegal
- Serbia
- Singapore
- Somaliland
- South Korea
- Spain
- Suriname
- Thailand
- Turkiye
- United Arab Emirates
- Ukraine
- United Kingdom
- Vietnam
-
Menu
-
About Us
Related content
![relatedcontent]()
Who We Are
DP World is the leading provider of smart logistics solutions, enabling the flow of trade across the globe.
Read More![relatedcontent]()
Investing in Growth
By 2025 DP World will invest almost 200 million euros to boost Antwerp Gateway’s capacity by a third up to 3.4 million TEUs.
Read More -
Services
Related content
![relatedcontent]()
Antwerp Gateway
Located at the upper end of the tidal estuary of the Scheldt, DP World Antwerp Gateway has excellent nautical access for the largest container vessels afloat.
Read More![relatedcontent]()
Empty Depot Services
Our off dock empty depot at the left bank of the river Scheldt offers a broad range of container services to Antwerp Gateway customers, such as storage, maintenance and repair.
Read More - Connectivity
-
Smart Trade
Related content
![relatedcontent]()
Route 1700 app
The Route 1700 app makes truck visits at DP World Antwerp easier. Truckers and dispatchers can check our busiest times and view current activity, traffic & other appointments. Truckers can plan their visit, according to their schedule.
Read More -
Sustainability
Related content
![relatedcontent]()
Our Approach
DP World’s ‘Our World, Our Future’ sustainability strategy helps us to work in a responsible way that prioritises sustainability and impact on the people, communities and environment...
Read More![relatedcontent]()
Sustainability Report
We are dedicated to sharing what we do with our customers, suppliers and partners to encourage sustainable practice.
Read More


Sustainability Report
-
CEO Interview
-
About us
-
CSR Strategy
- Environment subnav
- Safety subnav
- People subnav
- Society subnav
-
GRI
Occupational Accidents
KEY FIGURES
Occupational accidents
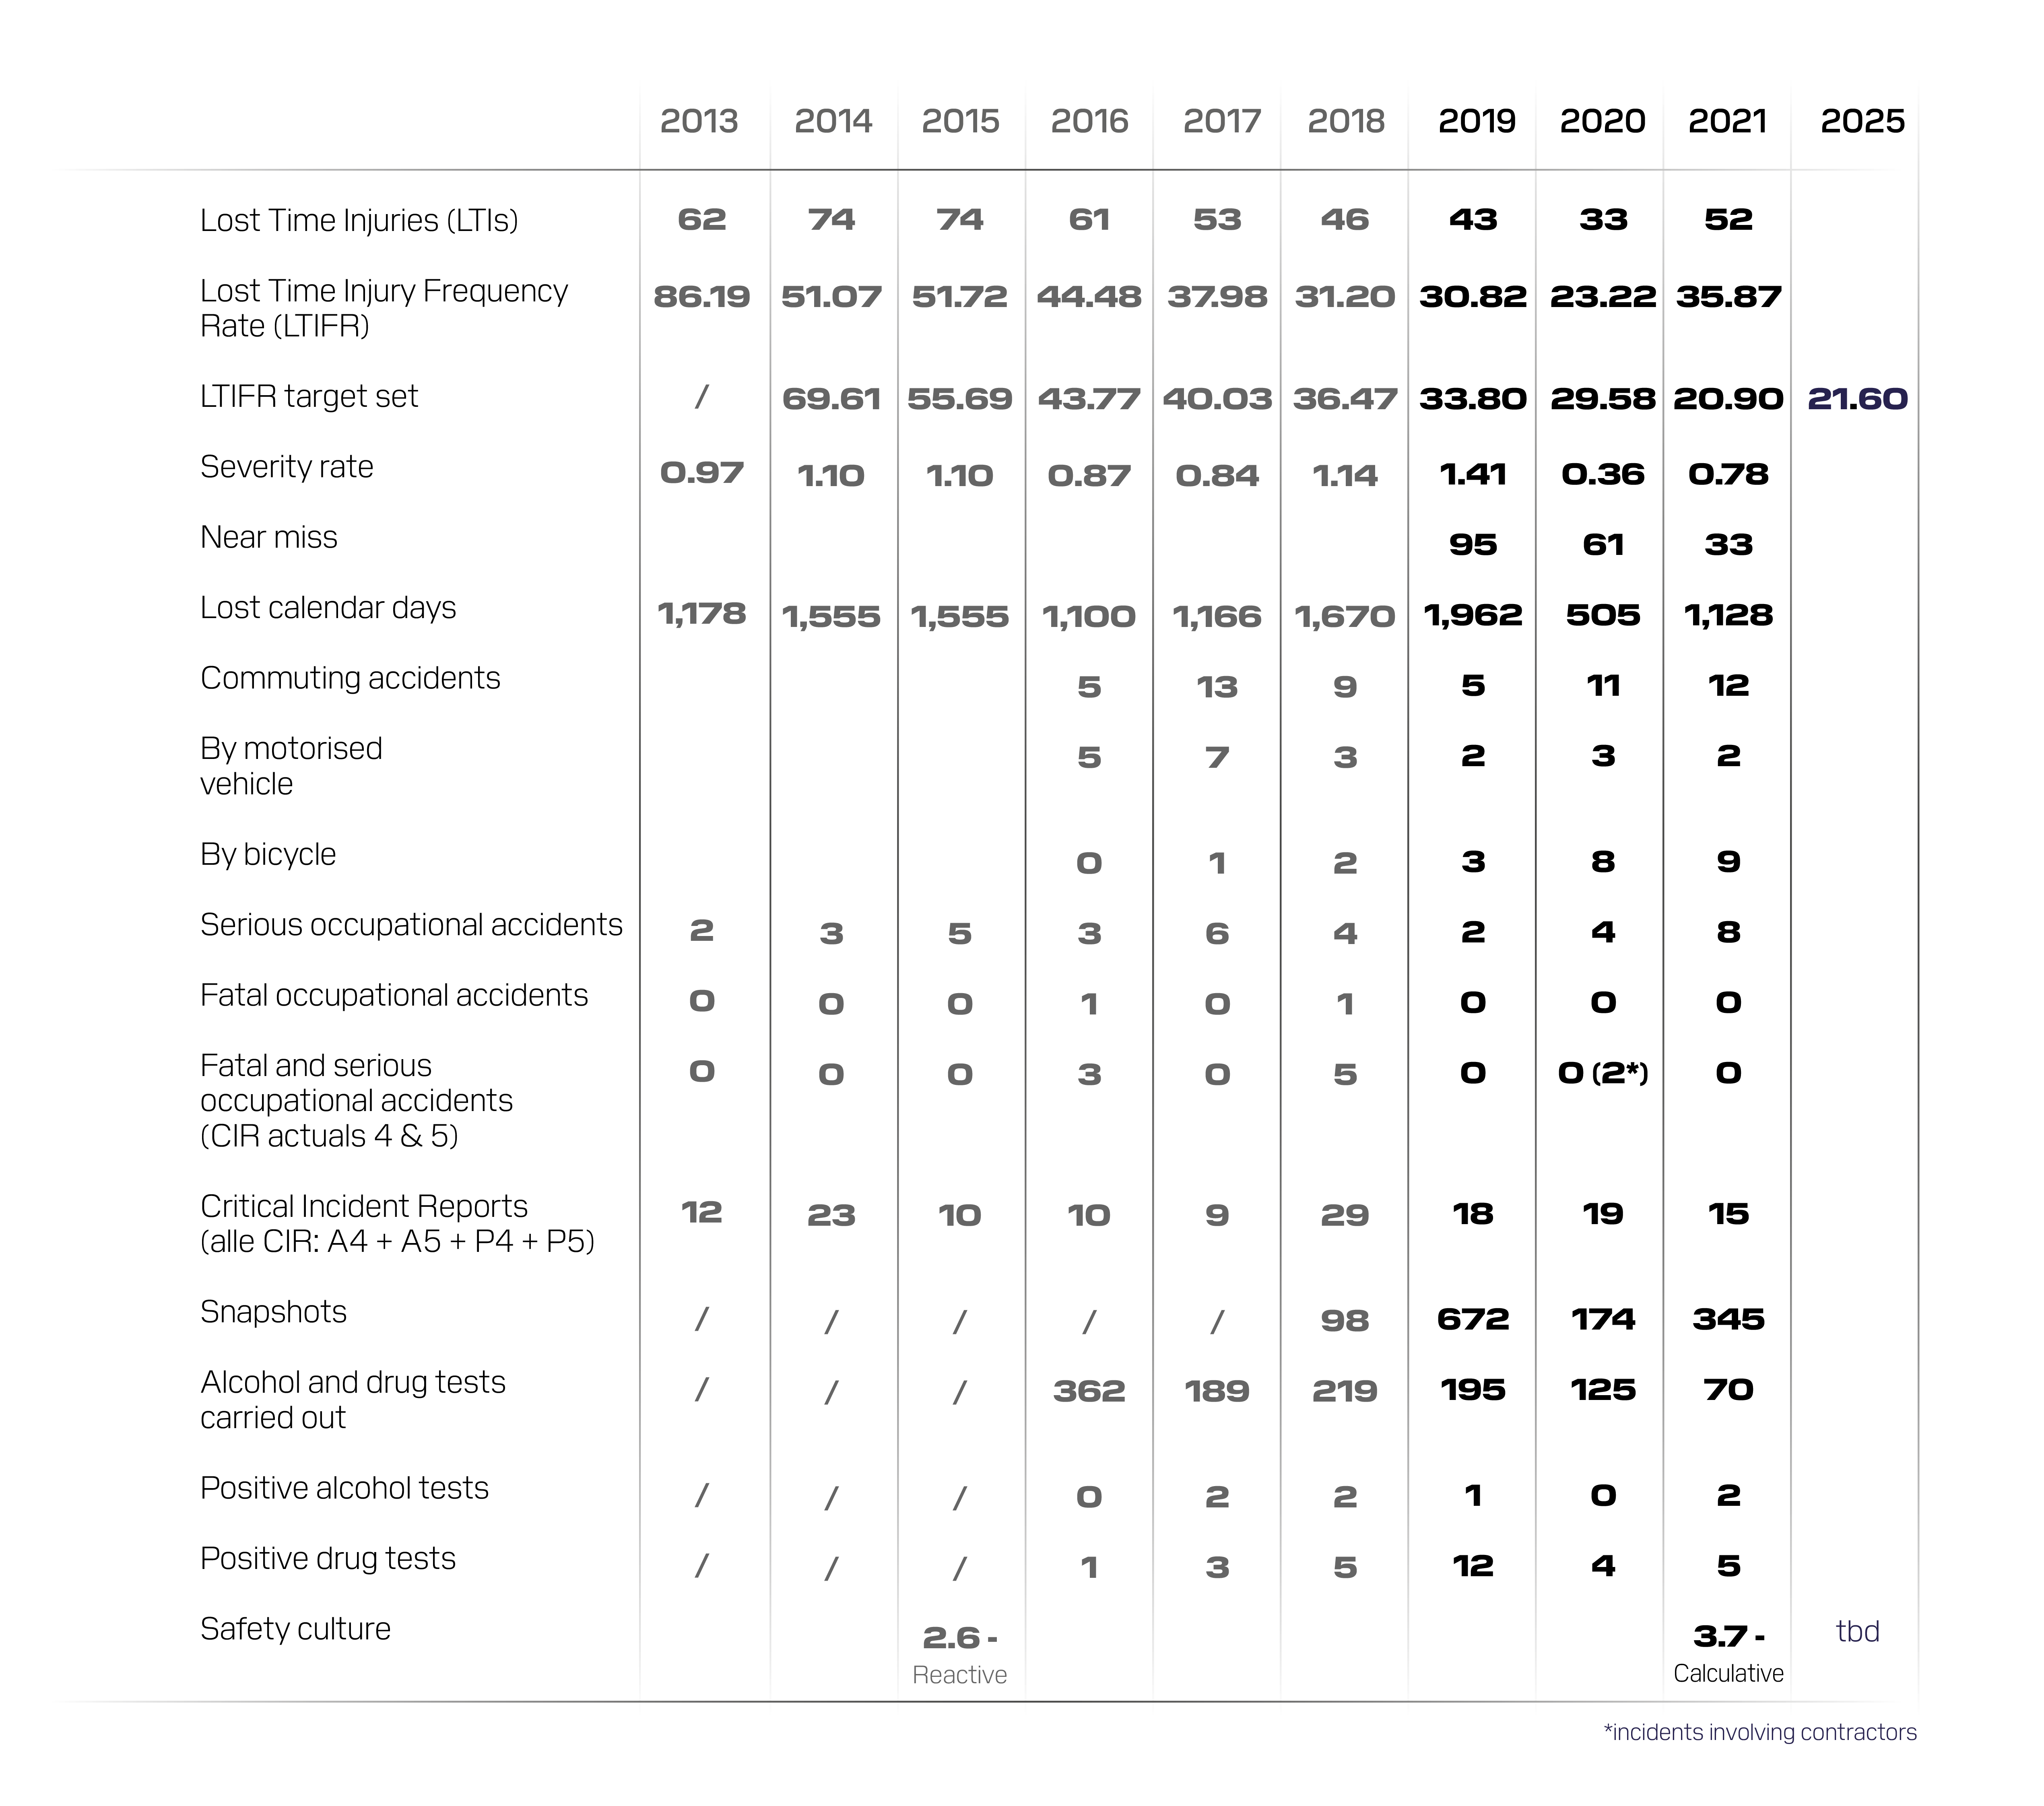
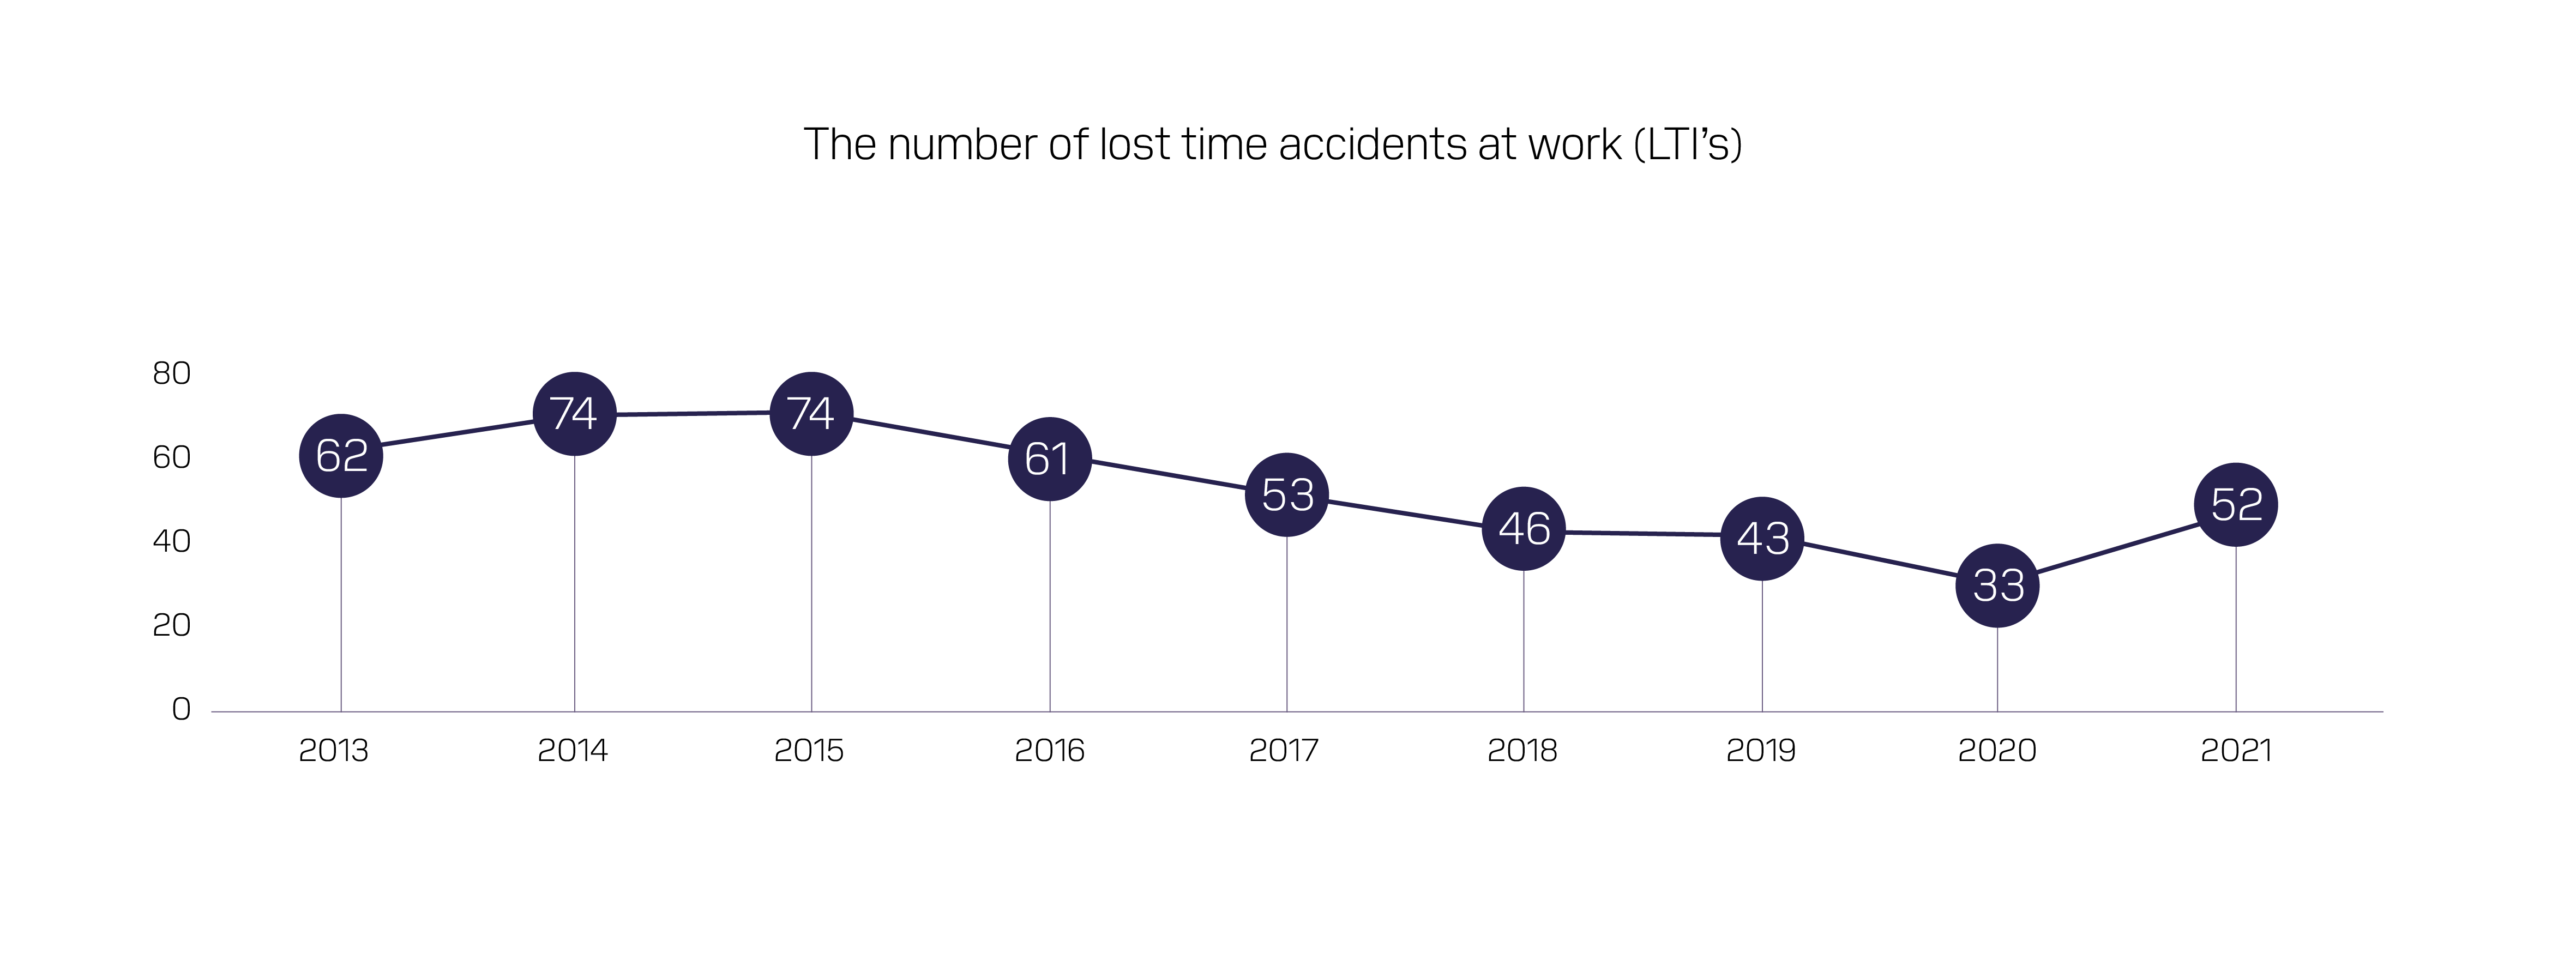
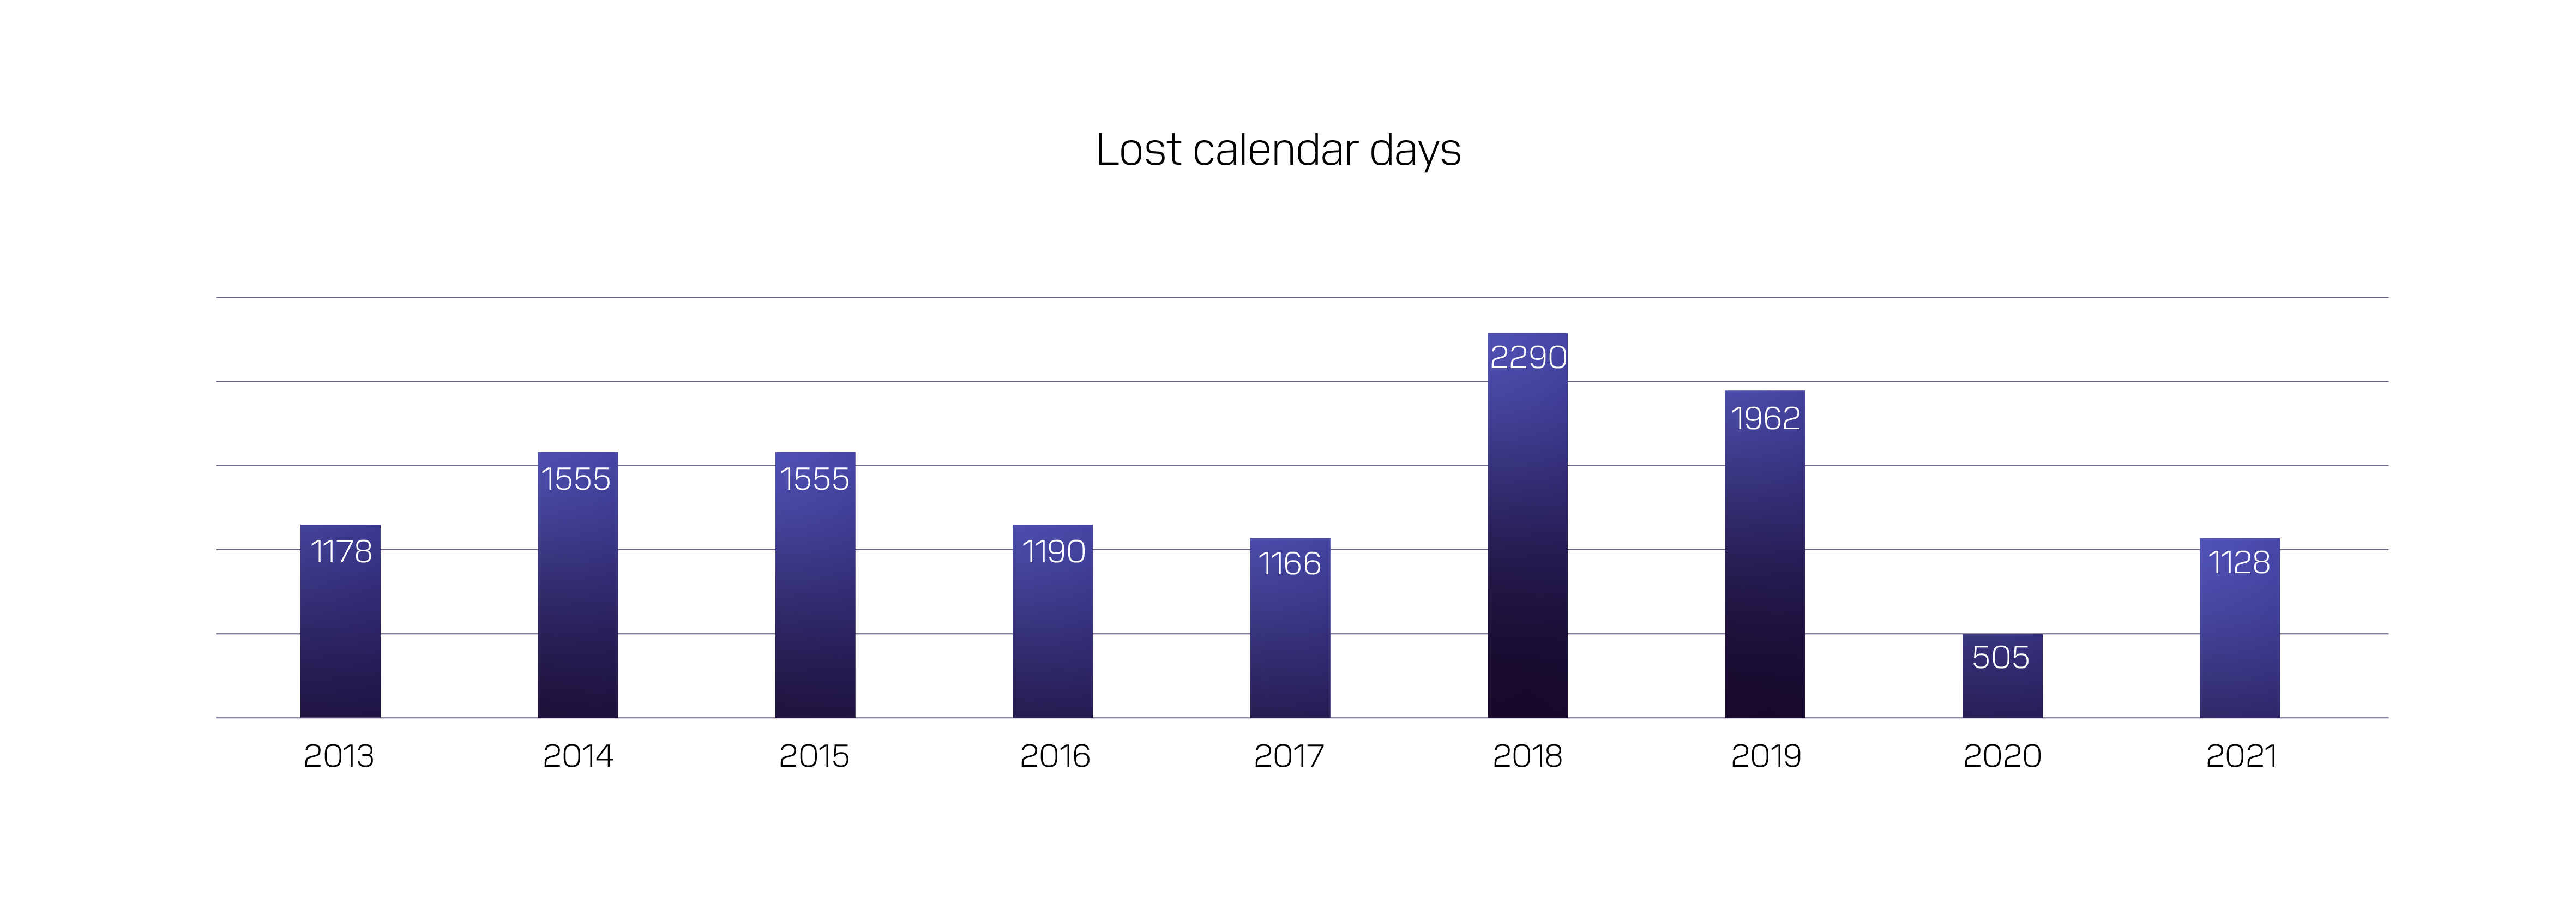
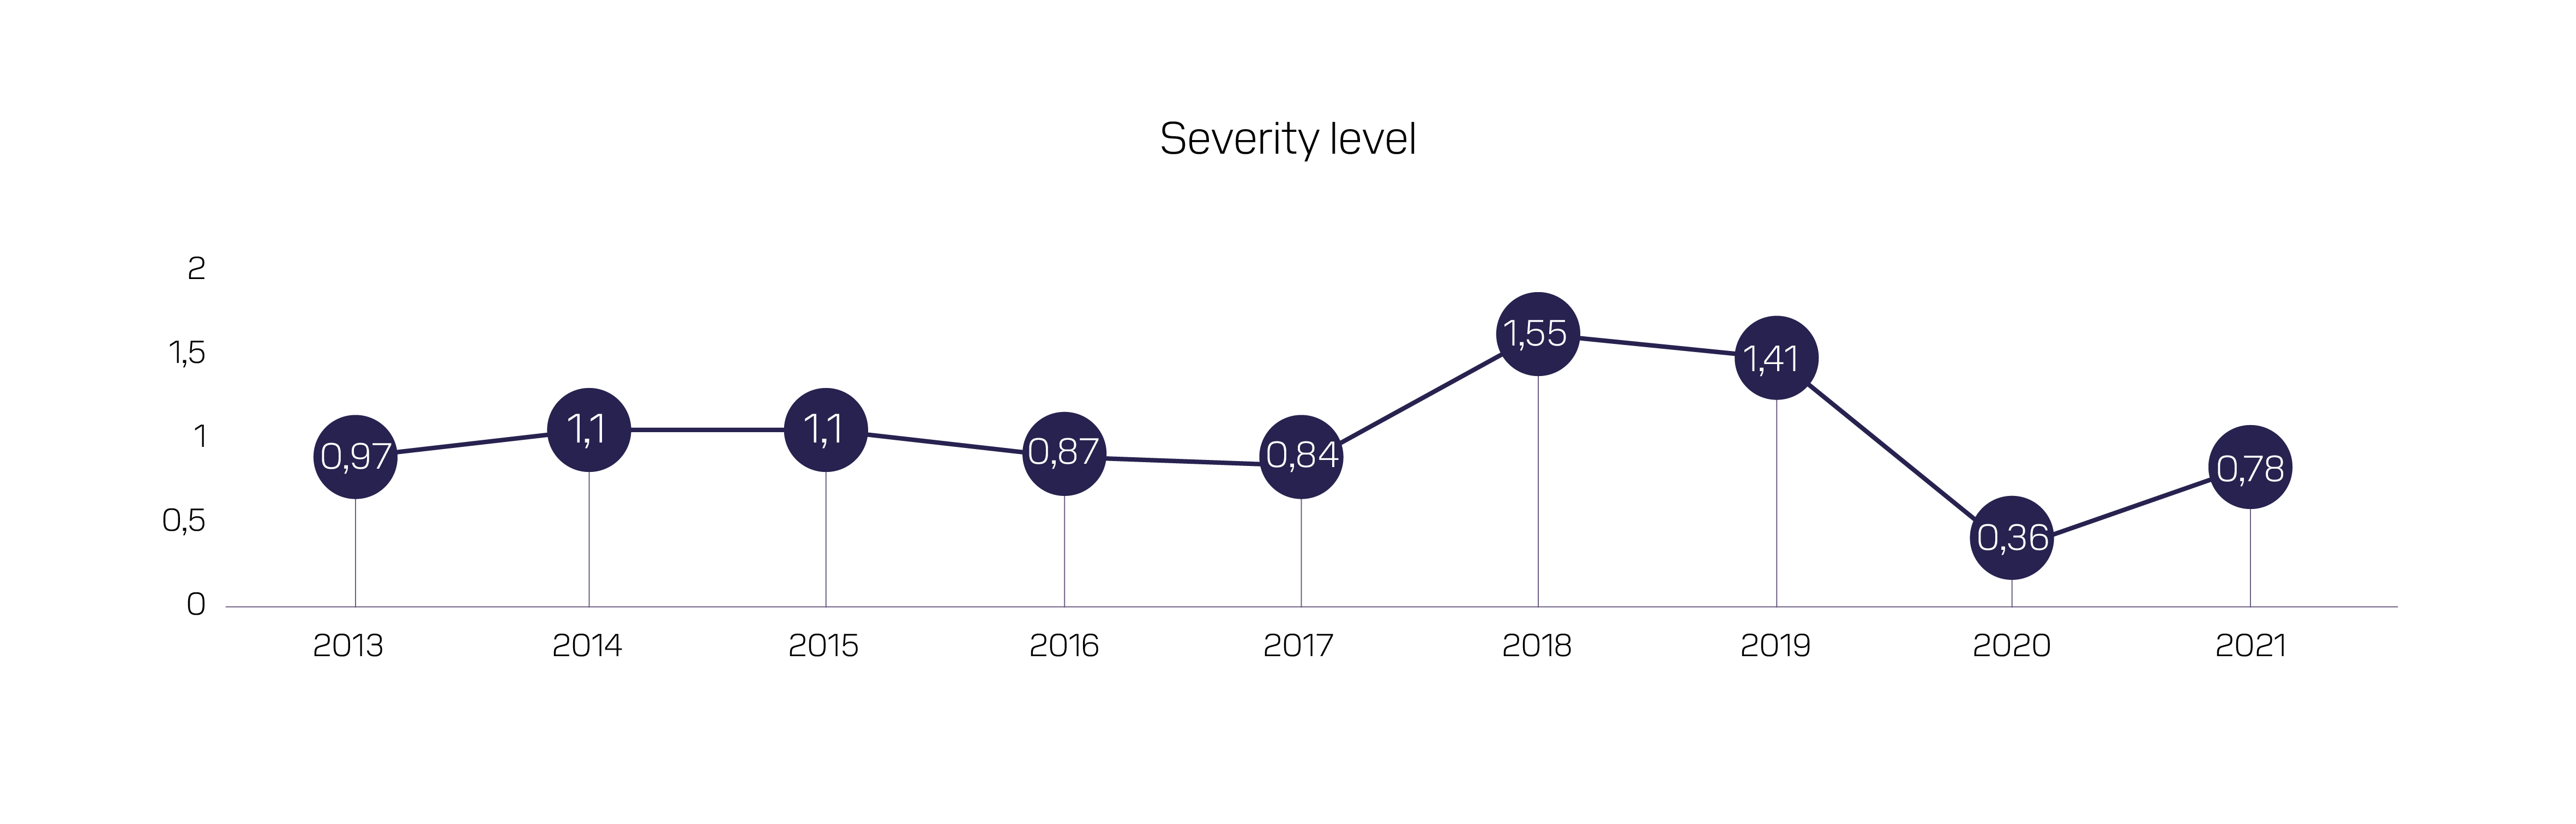
Whereas 2019 and 2020 saw a further significant decrease in the number of lost-time accidents, continuing the downward trend of the previous years, this decline was interrupted in 2021 with 52 lost-time accidents. Although the reduction of −30% envisaged in the global prevention plan of 2017–2021 compared with the frequency rate of 2016 was comfortably achieved in both 2019 and 2020, we unfortunately saw a substantial increase at the end of 2021. However, in terms of severity rate (the number of calendar days lost per thousand hours worked), a positive evolution can be seen from 2019 to 2021 with a decrease of 834 calendar days lost and a 44.8% lower severity rate. This means that although there were more accidents in 2021, they were less serious overall.
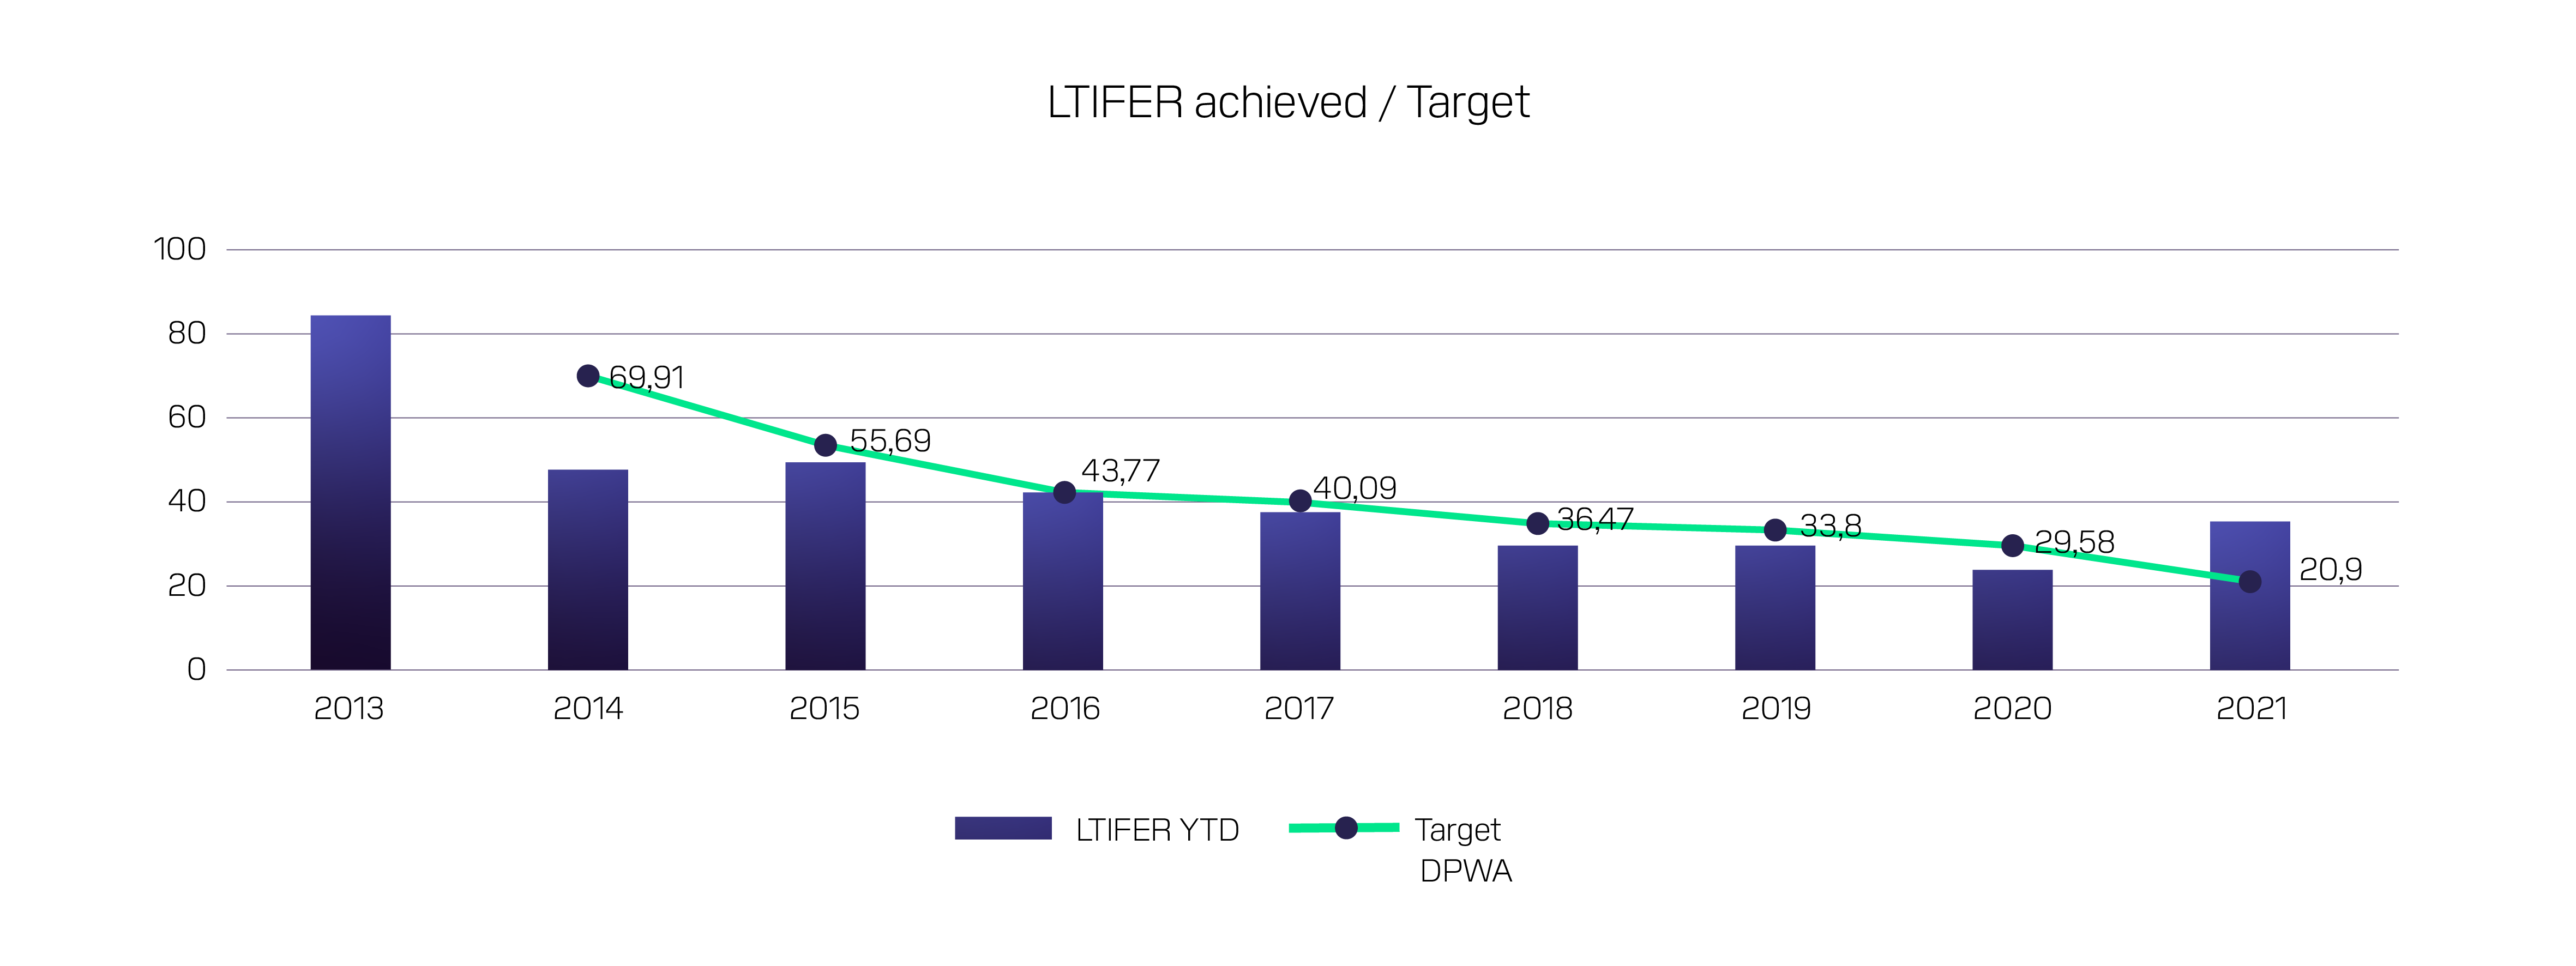
In the new global prevention plan 2021–2025, we are aiming for a target of 21.60 by the end of 2025.
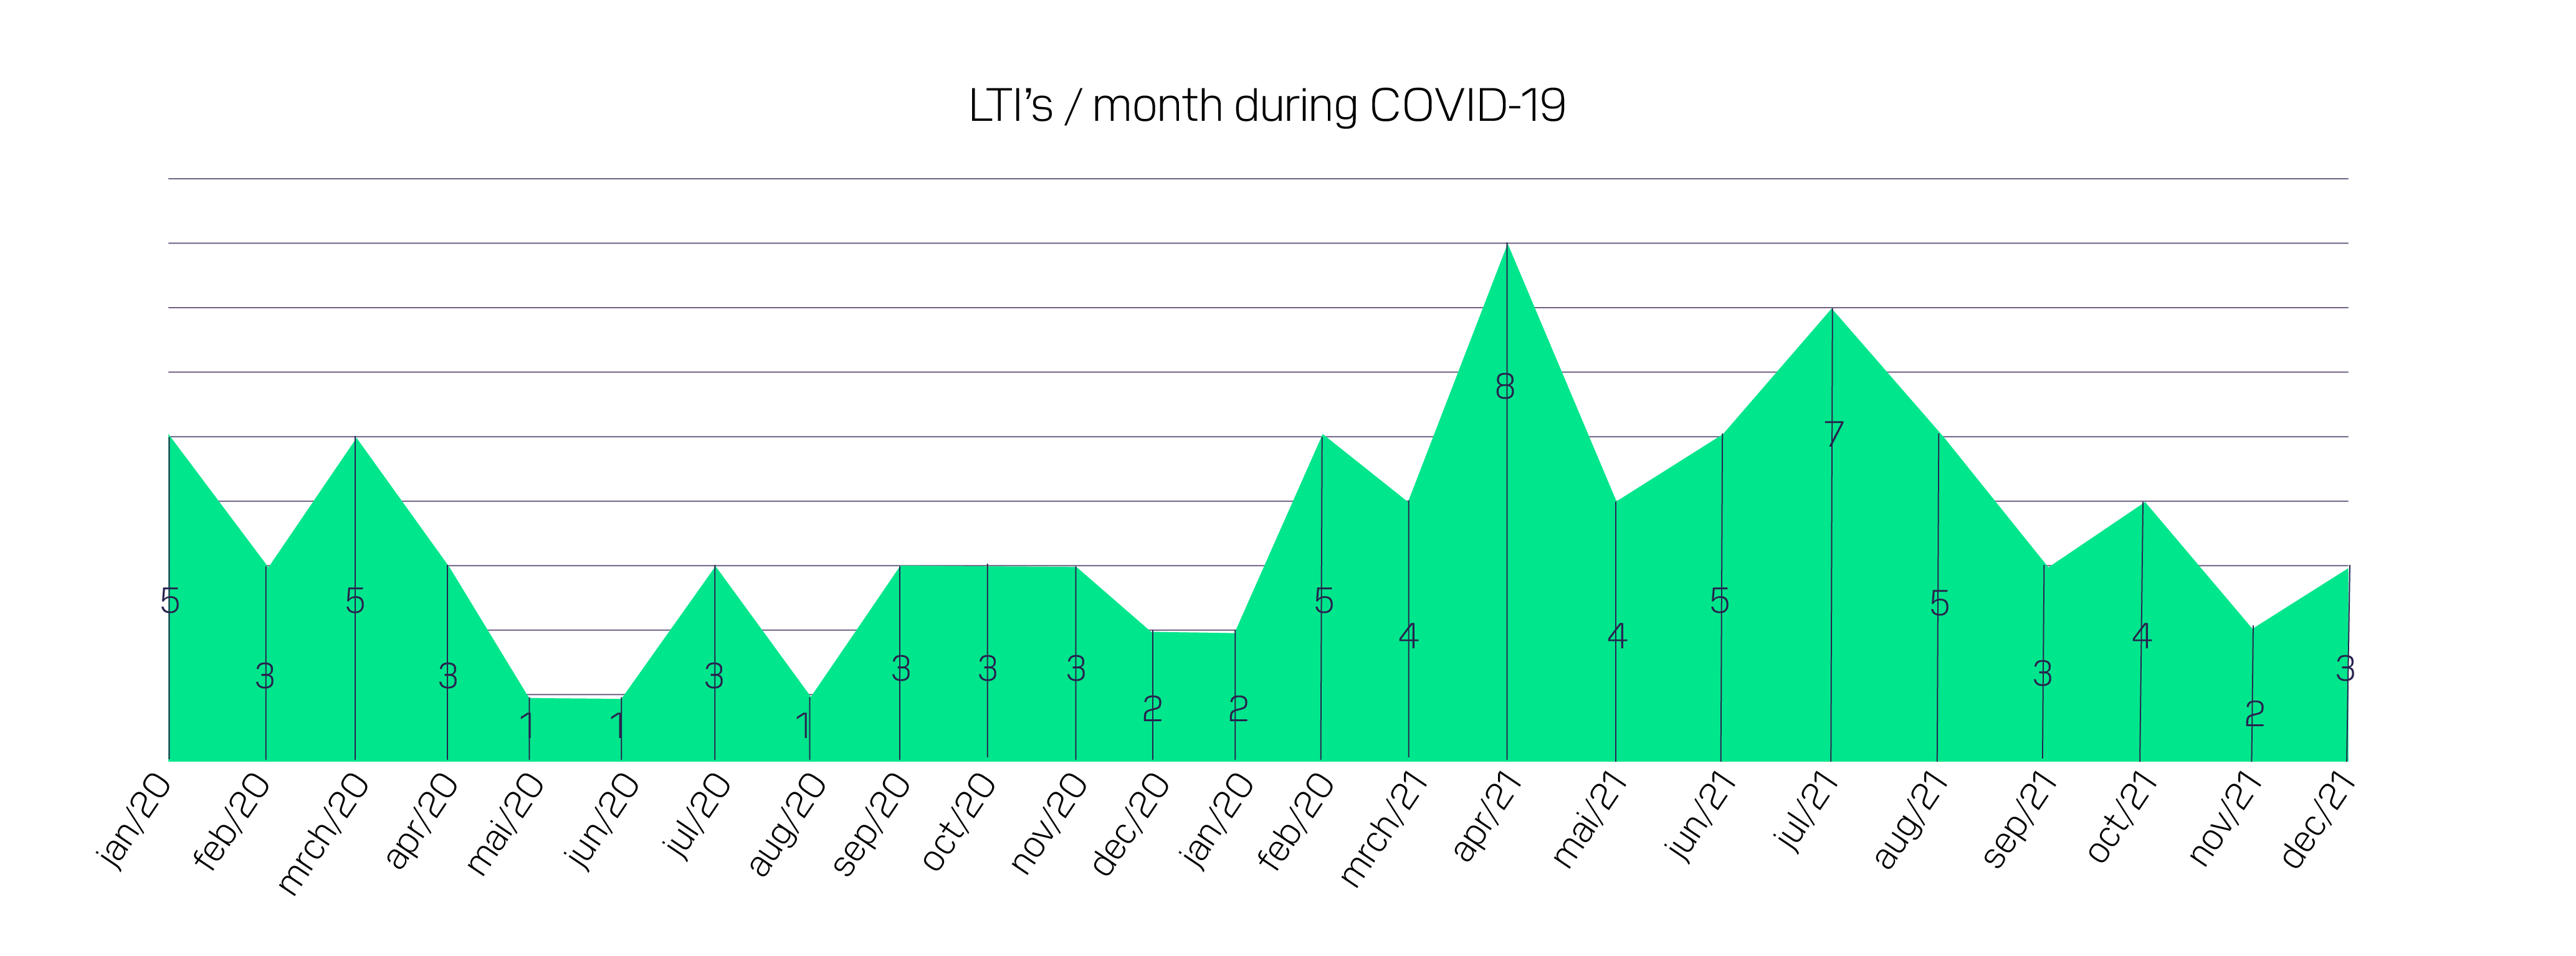
COVID-19
An increase of 20 lost-time accidents and a 57.9% higher frequency rate. The difference between 2020 and 2021 could not be more pronounced. There are several explanations. In 2021, we noticed a certain “coronavirus fatigue” and the frustrations that go with it. In addition, there were numerous changes at the terminal in 2021: creative stacking due to overcapacity, various changes in the straddle carrier parking area, relocation of the staff car park, relocation to the operations building, relocation of the release area, and changes in the truck flow.
By the end of 2021, these changes had largely been implemented and should have no longer had a negative impact on the figures. This was a positive trend that, fortunately, we were able to observe in the last few months of 2021.

We use cookies on this site to enhance your user experience. By continuing to visit this site you agree to our use of cookies. Learn More